Analytics Engineer in Marketing
How to Compare Your KPIs to Your Benchmarks with Google Sheets, BigQuery and Looker Studio
Most of my work revolves around marketing reporting, where it is essential not only to evaluate KPIs but also to determine if they meet expectations at any given moment, whether in the past or present. Therefore, having benchmarks, evaluating them in real-time, and visualising them against actual numbers are crucial for almost every project.
In tackling this challenge, I encountered several considerations. These included allowing stakeholders the flexibility to submit their benchmarks at any time, make adjustments during the month, and see the impact of these changes in a dashboard with the next data update. There are various solutions to address this need. There are more ways to do it, but I’ve chosen the simplest one.
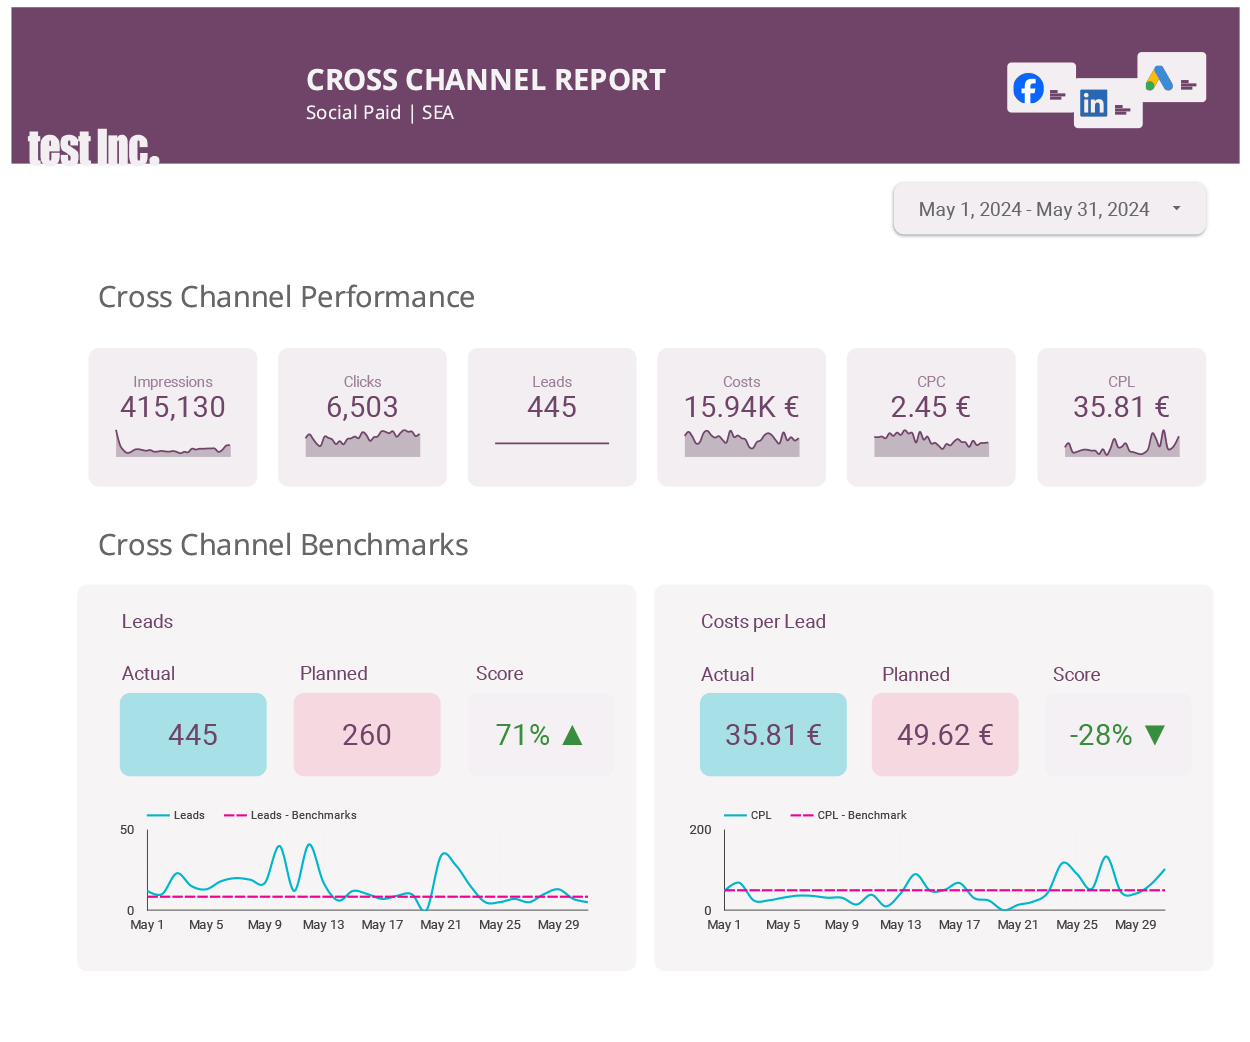
How a dashboard with benchmarks can look like
I generated dummy data for this purpose. This slide shows the main KPIs for the cross-paid channel report, comparing benchmarks provided by a user in a Google Sheet against actual values.
Problem definition
Before we start with the solution, I would like to define the problem and divide it into smaller parts:
– A user of the dashboard has the opportunity to submit all benchmarks per media per month for their reporting and change them at any time if needed in a tool that they can good handle
– These data should be taken into the DWH, transformed on a daily basis, and made ready for visualisation in a BI tool. As I work with BigQuery and Looker Studio, I will discuss the solution using these tools
– Make the process flow automatically from the stage immediately after user input to visualisation
Solution in steps
1. User input into a prepared Google Sheet
First of all, we need to create an environment for the user to fill in, change, delete, or, in other words, control their benchmark inputs. I have chosen Google Sheets for this purpose as it’s easy to implement, well-known, and offers native collaboration with the tools I use (BigQuery and Looker Studio).
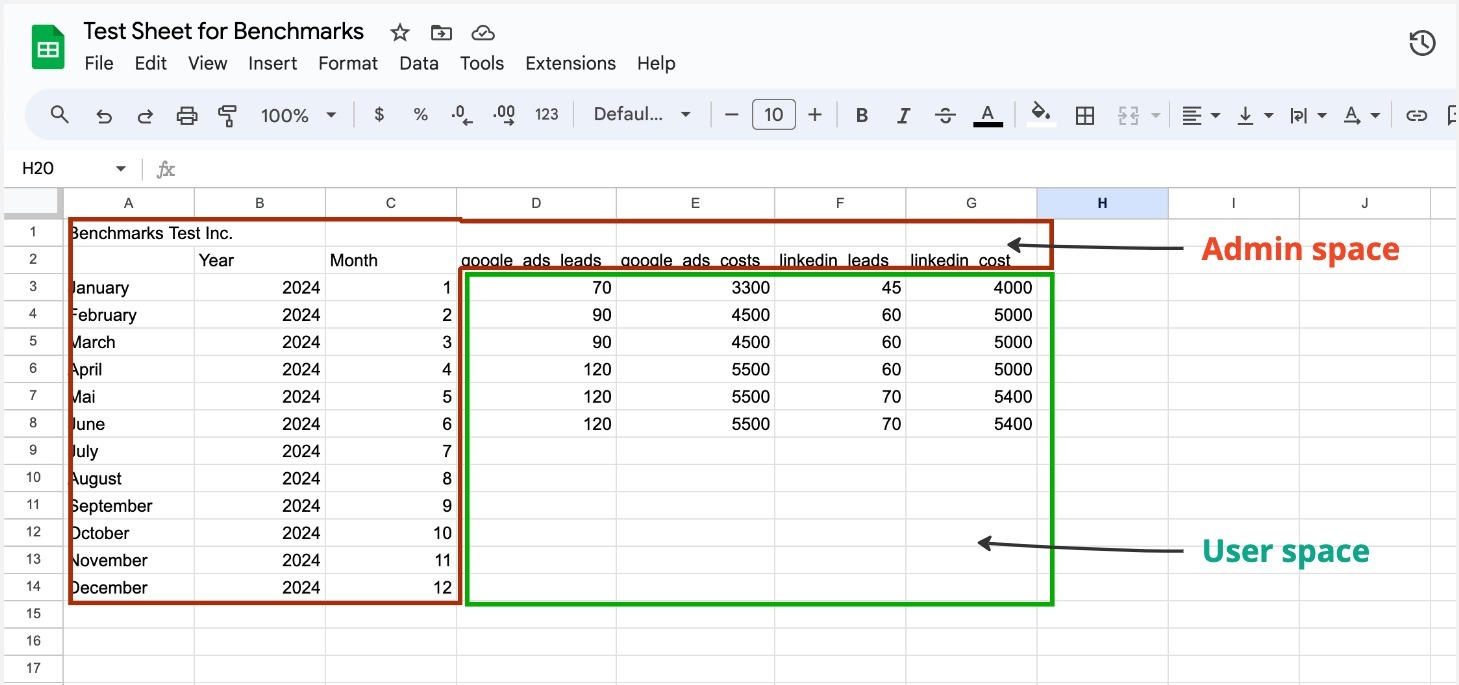
I had a situation before when users accidentally changed some information, which can break the connection with BigQuery. That is why I usually protect some areas on my spreadsheet before sharing the file with the user. Instructions on how to protect an area in a google sheet find here. In the screenshot below, you can see the admin area, which is the protected range, and the user area, which can be freely changed by the user.
2. Connect the spreadsheet with BigQuery
We are done with preparing the spreadsheet. Now we need to connect this spreadsheet to BigQuery. If you don’t have a BigQuery account follow the instructions here. Please be aware that we will have to schedule a query for this project. For that, you need to enable billing as the sandbox has very limited features. However, this doesn’t mean you have to pay for this project. BigQuery offers 1 TiB of data processing per month for free, which is far beyond the capacity we need for this project.
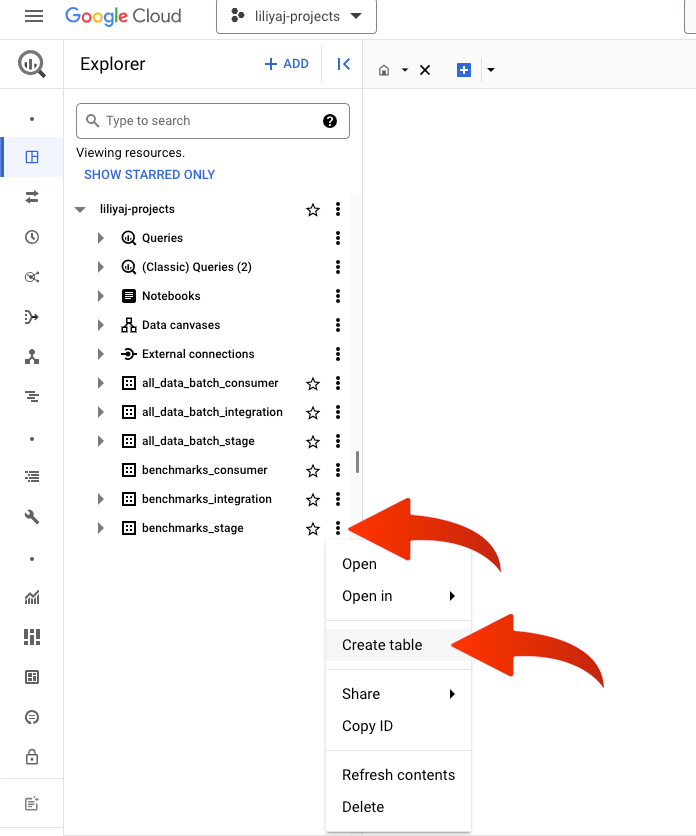
I usually organise the data I work with according to its preparedness to be consumed by steak holders. I really happy to have learned this approach from my peers. There are stage, integration and consumer levels of data organising. The stage dataset is where raw data is saved; the integration dataset is for transformed data; the consumer dataset is for end consumer tables. This spreadsheet connection belongs to the stage area, that is why the dataset is called benchmarks_stage. If you click on the three dots opposite the name of the dataset you will see a short menu, hit ‘Create table’.
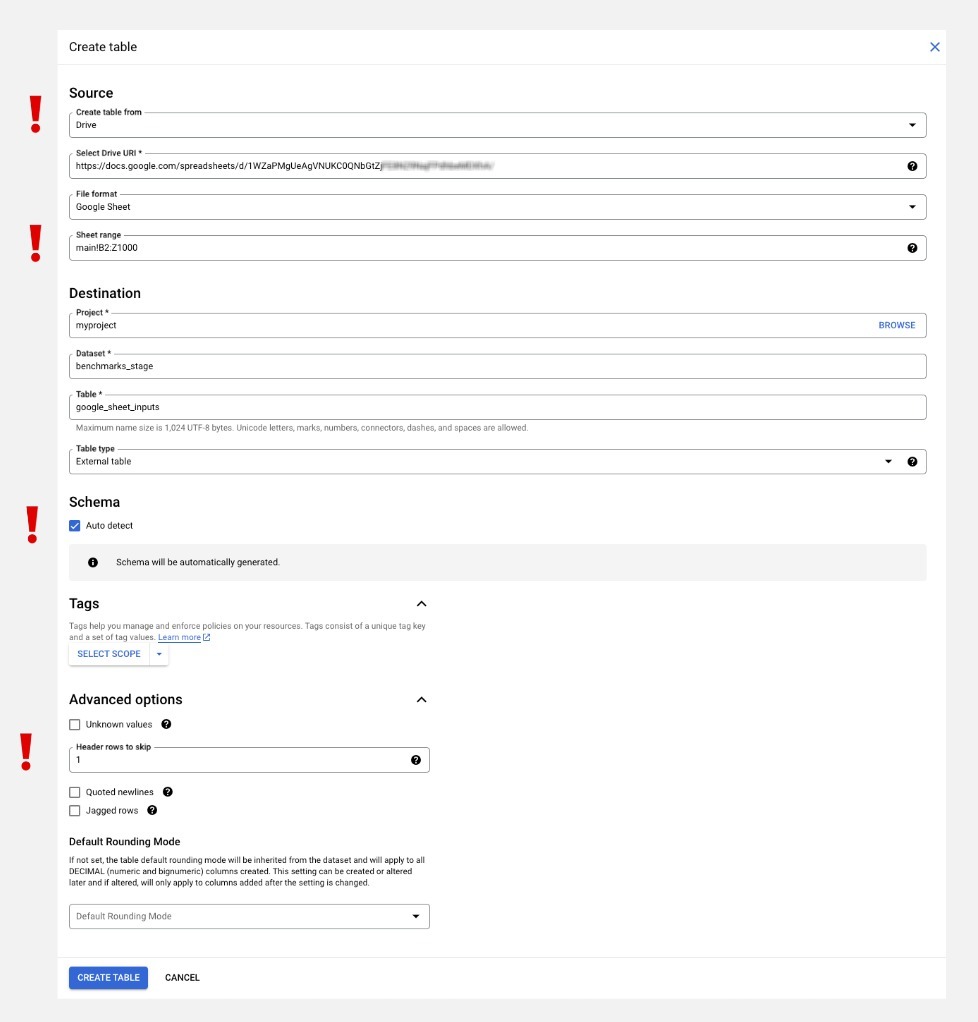
In the source section, you need to choose ‘Drive,’ provide the URL of your spreadsheet, and set the file format to Google Sheets. Once you’ve done this, you will see the field ‘Data range.’ Select only the range you need, and skip any information added for usability. For the table, we will need the year, month (in integer format), and all the columns with the benchmarks. Set the destination. Schema should be checked for auto-detected. In advanced options, fill in ‘Header rows to skip’ with 1. This defines the names of the columns in the new BigQuery table. If you query this new table
This was the preparation part. Congratulations! By now, you should have a spreadsheet for a user and a table in BigQuery with this data. If you query your new table, it will look exactly like your spreadsheet, except for the columns and rows you chose to omit.
3. Data transformation and integration
Now for the fun part! Let’s prepare a new table that will divide all the values per month by the number of days in each month and add a column with the date.
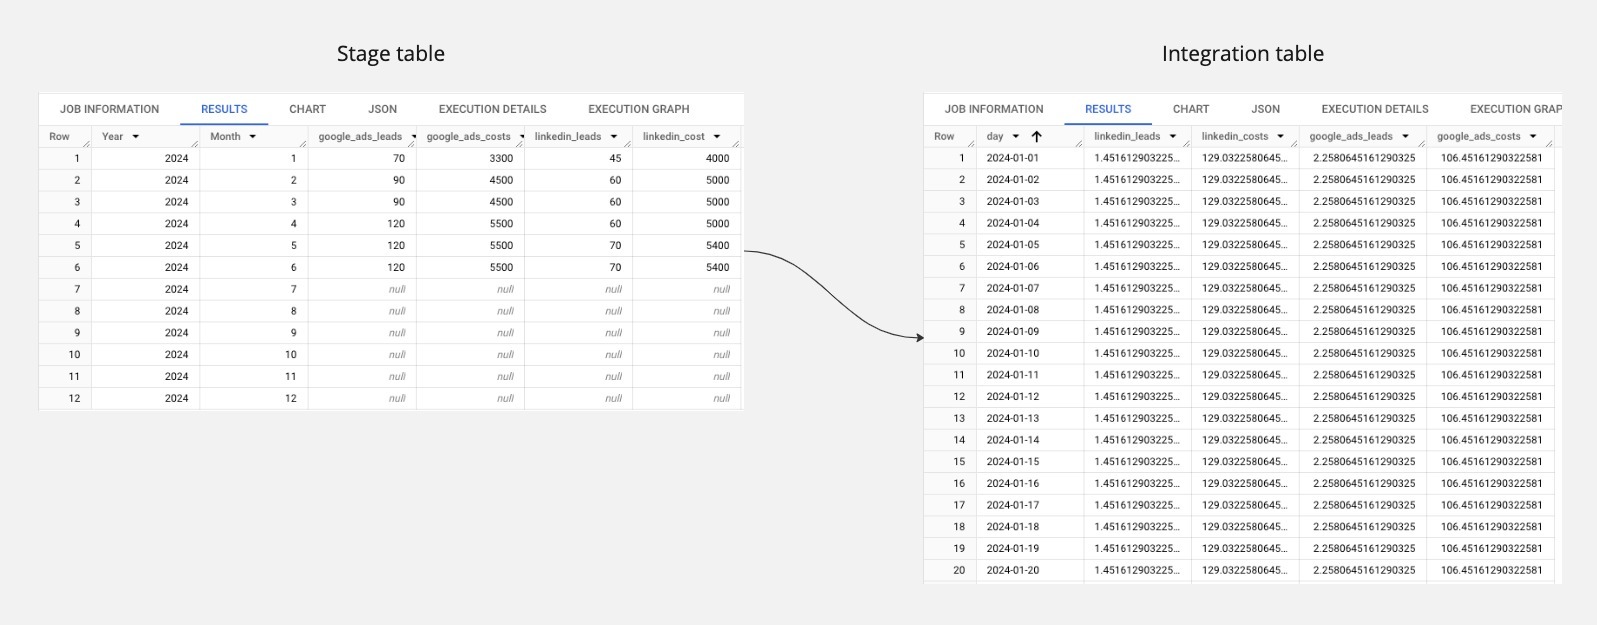
Now we are going to write and schedule a bit of SQL. We need to extract all the data from the spreadsheet, create a new table with a date column for every day, and divide our values per month by the number of days in the respective month. I love WITH clauses as they allow us to code in a very clear and understandable way. Our first WITH clause will be very simple:
					--get the data from the stage with google sheet values
WITH monthly_data AS (
  SELECT *
  FROM `myproject.benchmarks_stage.google_sheet_inputs`
),
Please feel free to name your project, dataset, and table as you wish. I used real names, as you can see in the screenshot above where we discussed creating a table in BigQuery. The next step is to generate dates for the range taken from our monthly_data clause. We take the minimum of the range, which in our table is January 2024, and the maximum, which is December 2024, and create every day between them.
					-- generate a list of all dates in the range of my data
all_dates AS (
  SELECT
    day
  FROM
    UNNEST(GENERATE_DATE_ARRAY(
      (SELECT MIN(DATE(year, month, 1)) FROM monthly_data),
      (SELECT MAX(LAST_DAY(DATE(year, month, 1))) FROM monthly_data)
    )) AS day
)
The third step is to calculate the values for each day and join this data with the all_dates clause data. We divide all month values by the last day of the respective month, as it represents the number of days in that month. Since all values per day in one month will be the same, it’s only important to join the data on the month and the year.
					-- add dates into the table and devide monthly values through the days in the respective month
  SELECT
    ad.day,
    md.linkedin_leads / EXTRACT(DAY FROM LAST_DAY(DATE(md.year, md.month, 1))) AS linkedin_leads,
    md.linkedin_kosten / EXTRACT(DAY FROM LAST_DAY(DATE(md.year, md.month, 1))) AS linkedin_kosten,
    md.google_ads_leads / EXTRACT(DAY FROM LAST_DAY(DATE(md.year, md.month, 1))) AS google_ads_leads,
    md.google_ads_kosten / EXTRACT(DAY FROM LAST_DAY(DATE(md.year, md.month, 1))) AS google_ads_kosten
  FROM
    all_dates ad
  JOIN
    monthly_data md
  ON
    EXTRACT(YEAR FROM ad.day) = md.year
    AND EXTRACT(MONTH FROM ad.day) = md.month
The last step is to wrap this whole code together in the CREATE OR REPLACE TABLE clause and schedule this query for the desired time period. Instead of wrapping the code into an extra clause, you can define your target dataset and table in the schedule dialog window. However, I prefer to do it in the code. So let’s do it this way.
					CREATE OR REPLACE TABLE `YOUR_PROJECT.YOUR_DATASET.benchmarks_per_day_2024` AS(
--get the data from the stage with google sheet values
WITH monthly_data AS (
  SELECT *
  FROM `myproject.benchmarks_stage.google_sheet_inputs`
),
-- generate a list of all dates in the range of my data
all_dates AS (
  SELECT
    day
  FROM
    UNNEST(GENERATE_DATE_ARRAY(
      (SELECT MIN(DATE(year, month, 1)) FROM monthly_data),
      (SELECT MAX(LAST_DAY(DATE(year, month, 1))) FROM monthly_data)
    )) AS day
)
-- add dates into the table and devide monthly values through the days in the respective month
  SELECT
    ad.day,
    md.linkedin_leads / EXTRACT(DAY FROM LAST_DAY(DATE(md.year, md.month, 1))) AS linkedin_leads,
    md.linkedin_kosten / EXTRACT(DAY FROM LAST_DAY(DATE(md.year, md.month, 1))) AS linkedin_kosten,
    md.google_ads_leads / EXTRACT(DAY FROM LAST_DAY(DATE(md.year, md.month, 1))) AS google_ads_leads,
    md.google_ads_kosten / EXTRACT(DAY FROM LAST_DAY(DATE(md.year, md.month, 1))) AS google_ads_kosten
  FROM
    all_dates ad
  JOIN
    monthly_data md
  ON
    EXTRACT(YEAR FROM ad.day) = md.year
    AND EXTRACT(MONTH FROM ad.day) = md.month
    )
Now you have a new pipeline that will periodically extract and transform your user input into daily benchmark values. You can join this table with your real data table, save it in a consumer dataset, and visualise it as shown in my example below. This automated process ensures that your data is consistently up-to-date and ready for analysis. By integrating this pipeline into your workflow, you can streamline your data management and improve the accuracy of your benchmarks.
Pros and Cons of this approach
Pros
1. Easy to implement
2. No extra front end solutions needed
3. Minimum tools involved
Cons
1. This pipeline is not fully automated. For instance, if a user adds a new column to the Google Sheet, you need to reconnect the spreadsheet with BigQuery and correct the schema.
3. The pipeline can be easily broken in other ways, for example, if a user inputs a string instead of an integer.
4. Computing costs were not taken into consideration, hence there is no cost optimisation in this solution.
In this repo you can find a solution, that anticipates all cons listed above. The ETL is done in Python and is deployable via Cloud Functions or Cloud Run.
Enjoy unlocking valuable insights with BigQuery and empower your marketing results!
Data Insights for Your Business Growth
@2024 Liliya Jeromin